Build Real time Twitter dashboard using Azure LogicApps + Power BI
In this post, we are going to learn how to build a real-time PowerBi dashboard using any of the trending Twitter hashtags (ex.#Rajinikanth hashtag) here we are going to analyze social media sentiment post Rajini’s political debut, by analyzing Twitter hashtags 🙂 hope you would like it!
Before looking at the steps, here’s a summary of what you’ll need.
- Azure account
- Power BI account (you can create it here)
- Cognitive services account (you can create it here)
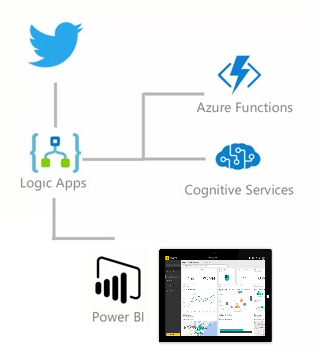
Quick Snapshot
Logic Apps provide a way to simplify and implement scalable integrations and workflows in the cloud. It provides a visual designer to model and automates your process as a series of steps known as a workflow. There are many connectors across the cloud and on-premises to quickly integrate across services and protocols. A logic app begins with a trigger and after firing can begin many combinations of actions, conversions, and condition logic.
Logic Apps is a fully managed iPaaS (integration Platform as a Service) allowing developers not to have to worry about building hosting, scalability, availability, and management. Logic Apps will scale up automatically to meet demand.

Logic Apps brings speed and scalability into the enterprise integration space. The ease of use of the designer, a variety of available triggers and actions, and powerful management tools make centralizing your APIs simpler than ever. As businesses move towards digitalization, Logic Apps allows you to connect legacy and cutting-edge systems together.
Once you login into the Azure portal, create a new Logic app like the below :


Create your logic app with the settings like the one below:

When you’re ready, select Pin to dashboard. That way, your logic app automatically appears on your Azure dashboard and opens after deployment. Choose to Create.
After Azure deploys your logic app, the Logic Apps Designer opens and shows a page with an introduction video. Under the video, you can find templates for common logic app patterns. We are going to choose the ‘When a new tweet is posted’ trigger.
Every logic app workflow starts with a trigger. The trigger fires when a specific event happens or when new data meets the condition that you set. Each time the trigger fires, the Logic Apps engine creates a logic app instance that starts and runs your workflow.


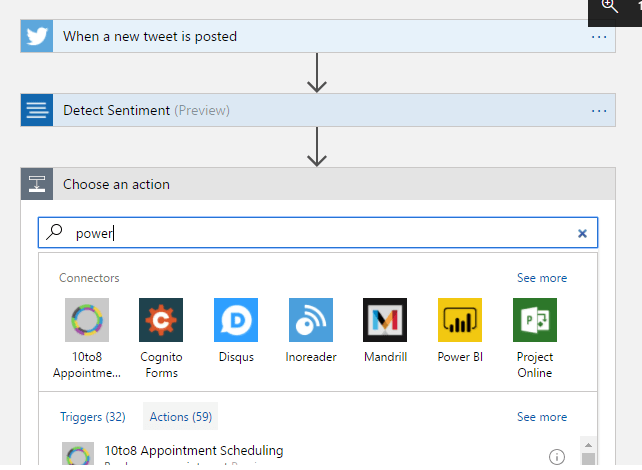
Now that you have a trigger, add an action that invokes cognitive services to detect the sentiment when a new item appears in the Twitter feed. Your workflow performs this action after the trigger fires.


Image – Choose action as ‘Text Analytics’
 Image – Choose ‘Detect Sentiment’ among the actions
Step # 2: Create Cognitive Services (API keys for text analytics)
Text Analytics API is a cloud-based service that provides advanced natural language processing over raw text and includes three main functions: sentiment analysis, key phrase extraction, and language detection.
Sentiment Analysis API returns a sentiment score between 0 and 1 for each document, where 1 is the most positive. Azure models are pretrained using an extensive body of text and natural language technologies from Microsoft. For selected languages, the API can analyze and score any raw text that you provide, directly returning results to the calling application.
What we are going to do is submit data for analysis and handle outputs in our code. Analyzers are consumed as-is, with no additional configuration or customization. We would need to get the API key, this key must be passed on each request.

Once you sign up, you would receive an API key and REST endpoint. Enter the same, in the ‘Detect Sentiment’ step of the Logic app.

Once you click on the ‘Create’ button. Choose ‘Tweet Text’ to detect sentiment.

Step # 3: Create Power BI streaming data set
With Power BI real-time streaming, you can stream data and update dashboards in real-time. Any visual or dashboard that can be created in Power BI can also be created to display and update real-time data and visuals. The devices and sources of streaming data can be factory sensors, social media sources, service usage metrics, and anything else from which time-sensitive data can be collected or transmitted.
Login to PowerBI and create a Streaming dataset (At the top right you can press the plus button to create a new streaming data set.)


Here we would define our streaming dataset, you can define your variable names and types here. I’m going to add 3 variables for now but this can be extended as required. The important point is, make sure you check the ‘Historic data analytics’ slider to On.

Once you click on the ‘Create’ button there would be Push URL created for this dataset, we can go back to Logic App & Add a new step and search for ‘Power BI’ then add this step which should look as follows:
Step # 4: Add Power BI action to push the Sentiment analysis data

Step # 5: Design Power BI dashboard
Once you login into your Power BI account, locate your data sets and click on the graph icon as shown below.

On the dashboard, I have added a graph with the sentiment over time and a text box that just displays the count of tweets.


Now you can navigate to the dashboard and see the counter go up every time a tweet is tweeted!
Here is the final output

I have added some more elements like map etc., & here is the final one.

Like this post? Don’t forget to share it!
Useful Resources
- Serverless tutorial – On HTTP trigger store data in Azure Cosmos DB
- Serverless tutorial – Invoke Azure functions using HTTP Trigger
- Serverless Comparison : AWS Lambda vs. Azure Functions vs. Google Functions
- OpenFaaS Tutorial: Build and Deploy Serverless Java Functions
- Kubeless tutorial – Kubernetes native serverless framework
- Visualize IoT-scale time-series data using Azure Time Series Insights
Summary
Article Name
Build real time Twitter dashboard using Azure LogicApps + Power BI
Description
In this post, we are going to look how to build a real-time PowerBi dashboard using any of trending Twitter hashtags.
Author
Karthik
Publisher Name
Upnxtblog
Publisher Logo
One thought on “Build Real time Twitter dashboard using Azure LogicApps + Power BI”
Leave a Reply


More Stories
Trends in Metaverse Development Platforms: Choosing the Right Platform for Your Project
The launch of VisionPro and the ongoing buzz of the Metaverse smart-glass launch are paving the way for future internet...
The Startup Guide to Acquiring Exceptional Developers
In the fiercely competitive world of Hire Developers for Startup, success hinges not just on your product or service, but...
Unlock the Potential of Java Microservices for Scalable Solutions
In today's rapidly evolving digital landscape, businesses and developers are continuously searching for efficient, scalable solutions to meet their complex...
5 Secret Weapons to Level Up Your Node.js Game in 2024
In the rapidly evolving landscape of web development, Node.js has emerged as a powerhouse, driving the development of scalable and...
Exploring Python’s Role in Predictive Analytics for Business
Python, a versatile and dynamic programming language, has gained traction in various fields, with business analytics being one of its...
Optimizing Performance in ReactJS Applications
ReactJS is a popular framework known for its efficiency and flexibility in building interactive user interfaces. However, as your application...
[…] you’re working with Microsoft Power BI, then you need to know the basics of DAX. This intuitive formula language is the key to […]