Tutorial : Visualize historical data with ELK stack
Today we are going to learn about the ELK stack, it consists of 3 powerful open-source tools Elasticsearch, Logstash, and Kibana. Elasticsearch is a highly scalable open-source full-text search and analytics engine. It allows you to store, search, and analyze big volumes of data quickly and in near real-time. Kibana is like a window into the Elastic Stack. It enables visual exploration and real-time analysis of your data in Elasticsearch. Logstash is the central dataflow engine in the Elastic Stack for gathering, enriching, and unifying all of your data regardless of format or schema.
Quick Snapshot
What is Elasticsearch?
Like mentioned before, Elasticsearch is a highly scalable search engine that runs on top of a Java-based Lucene engine. It is kind of a NoSQL database, it stores data in an unstructured format. Data would be inside the documents instead of tables and schemas.
Key Concepts :
- Indexing is the process of adding data to Elasticsearch. An index is a collection of documents that have similar characteristics ex. stock data. An index is identified by a name and this name is used to refer to the index when performing indexing, search, update, and delete operations against the documents in it. Indexing is similar to the creation and update process of CRUD operations.
- The document is a JSON document that is stored in Elasticsearch. You can think of it as a row in a table in a relational database.
- Mapping is like a schema definition in a relational database. A mapping can either be defined explicitly, or it will be generated automatically when a document is indexed.
- Search can be defined by one or more queries that can be mixed and matched in endless combinations.
Click here to learn more.
What is Kibana?
Kibana is an open-source analytics and visualization platform designed to work with Elasticsearch. You can search, view, and interact with data stored in Elasticsearch indices. Also, you can easily perform advanced data analysis and visualize your data in a variety of charts, tables, and maps.
Kibana has a browser-based interface that enables you to quickly create and share dynamic dashboards that display changes to Elasticsearch queries in real-time.
What is Logstash?
Logstash is an open-source data collection engine with real-time pipelining capabilities. With Logstash you can dynamically unify data from various sources and normalize the data into any of the destinations. You can also cleanse your data for diverse advanced downstream analytics and visualization use cases.

Key Concepts :
- Input Plugin: Logstash plugin that reads event data from a specific source. Input plugins are the first stage in the Logstash event processing pipeline. Popular input plugins include file, Syslog, Redis, and beats.
- Output Plugin: Logstash plugin that writes event data to a specific destination. Outputs are the final stage in the event pipeline. Popular output plugins include elastic search, file, graphite, and statsd.
- Pipeline: This is used to describe the flow of events through the Logstash workflow. A pipeline typically consists of a series of input, filter, and output stages.
Click here to learn more.
In this tutorial, we are going to look at how to create an index, analyze & visualize historical data using ELK stack. Here is an overview of the steps involved
- Download ELK stack
- Load a sample historical data set into Elasticsearch
- Define an index pattern
- Visualize the data
- Assemble visualizations into a dashboard

Step #1.Download ELK stack
Head over to the Downloads section and download all 3 of them, for this tutorial I’m using Windows 10 Platform. For other platforms, please use the respective packages.

Unzip the contents of the zip file.

Step #1(a).Start Elasticsearch
Under the Elasticsearch\bin folder, execute elasticsearch.bat to start the Elasticsearch engine.

Wait for the Elasticsearch server to start, look for started keyword on the console.

To check whether the server has started properly or not, go to the Elasticsearch application with the default port# (9200).

If you get the above output, this indicates your Elasticsearch server has started successfully.
Step #1(b) Start Kibana
Under Kibana*\bin folder, execute kibana.bat to start the Kibana server

Wait for the Kibana server to start, look for server running keyword on the console.

To check whether the server has started properly or not, go to the Kibana application with the default port# (5601).

We have configured both Elasticsearch & Kibana, our next step is to load data using Logstash.
Step #2.Load a sample historical data set
For the sample data set, I have downloaded it from Yahoo Finance Historical data. Below is a sample of the raw data.

The next step is to load the data from CSV files to Logstash. For this purpose, we are going to use the CSV plugin to get the data from the file source. Logstash can also read the number of other input sources too. To load the sample, we would need to create a simple config file. We are going to use the file input in this case. The input section of our configuration file looks like this:
input {
file {
path => "C:/Karthik/Blog/logstash-6.3.0/bin/data.csv"
type => "core2"
start_position => "beginning"
}
}
Now our input section is ready, next is to identify the data from the file, and optionally we can also cleanse/manipulate or any other operations with the source. For this we are going to use CSV filter plugin, if you’re looking for other sources like JSON etc.,, check out here. Also here we are going to convert all fields from the CSV file to a numeric data type (float) so that we can be able to visualize the data.
filter {
csv {
separator => ","
columns => ["Date","Open","High","Low","Close","Volume","Adj Close"]
}
mutate {convert => ["High", "float"]}
mutate {convert => ["Open", "float"]}
mutate {convert => ["Low", "float"]}
mutate {convert => ["Close", "float"]}
mutate {convert => ["Volume", "float"]}
}
The next step is to output data directly to Elasticsearch, we are using the Elasticsearch output. There is also an option for multiple output adapters for streaming to different outputs. In this case, we have added the stdout output for seeing the output in the console. Also, note we have to specify an index name for Elasticsearch. This index will be used later for configuring Kibana to visualize the dataset. Below, you can see the output section of our logstash.conf file.
output {
elasticsearch {
action => "index"
index => "stock"
hosts => "localhost"
workers => 1
}
stdout {}
}
Step #3.Define an index pattern
Like we have discussed before,post loading data into Elasticsearch we would need to create an index pattern. An index is a collection of documents that have similar characteristics ex. stock data. An index is identified by a name and this name is used to refer to the index when performing indexing, search, update, and delete operations against the documents in it. Indexing is similar to the creation and update process of CRUD operations.
Make sure Kibana is running and log in to the console, under the ‘Management’ tab you can find the option to create an Index pattern under Kibana. Enter the name of the index that was specified before when inserting the data with Logstash (“stock”). Kibana will then ask for a field containing a timestamp which it should use for visualizing time-series data. for our case, this is the “Date” field.


Now that we have created the index pattern,next step is to create visualizations.
Step #4.Visualize the data
We are going to create three different types of visualizations and assemble them into one Dashboard. Choose “Visualize” from the top menu to create new visualization and choose the search source as ‘stock’.
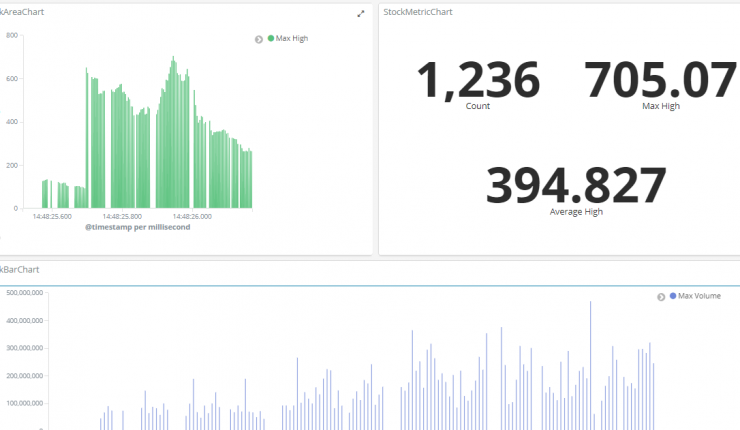
We are going to create the following 3 visualizations
- Area chart to show the max value of the “High” field in our dataset
- Vertical Bar chart to show the volume of stock each day
- Metrics chart to display count, max high & average high data
For the first visualization, choose visualization type as Area chart and then for the data to use for the x- and y-axis. For the y-axis, we want to have the max value of the “High” field in our dataset. The x-axis is configured to be a date histogram showing the “Date” field in a daily interval.

Save the visualization so that we can use it later while we create a dashboard.
For the next one, choose visualization type as Vertical Bar chart and then for the data to use for the x- and y-axis. For the y-axis, we want to have the max value of the “Volume” field in our dataset. The x-axis is configured to be a date histogram showing the “Date” field in a daily interval.

For Metrics visualization, choose visualization type as Metrics and then to add 3 metrics Count, Max High & Volume High.

Now we have all 3 visualizations ready,next step is to create a dashboard.

Step #5.Assemble visualizations into a dashboard
To create a new dashboard, navigate to the “Dashboard” section in Kibana. You can now add the visualizations to the dashboard using the “+” icon in the upper right corner.

You can also drag and resize the widgets as you like to customize the dashboard. Also, if you notice you can filter data by zooming the charts or selecting a different time range.

Congrats! we have learned how to visualize historical data with ELK stack
Like this post? Don’t forget to share it!
Additional Resources
- Elasticsearch reference
- Kibana reference
- Logstash reference
- How to aggregate Docker Container logs and analyse with ELK stack ?
- All You Need To Know About Kong API Gateway + tutorial
Summary
Article Name
Tutorial : Visualize historical data with ELK stack
Description
ELK stack consists of 3 powerful open source tools Elasticsearch, Logstash, and Kibana.In this tutorial,we are going to look at how to create index,analyse & visualize historical data using ELK stack.
Author
Karthik
Publisher Name
Upnxtblog
Publisher Logo
More Stories
The Impact of Graphics and Animation in Ludo Game Development: Explained
Introduction Ludo has emerged as a beloved classic. Reinvented for the digital age, the game is hooking global audiences with...
Most Recommended Video Editor for YouTubers in 2024
As the world of video content creation is booming, YouTube is the platform of choice for aspiring creators and established...
Strengthening Cyber Defenses: The Benefits of Outsourcing Cybersecurity
In today's interconnected digital realm, cybersecurity stands as a paramount concern for organizations, irrespective of their scale. With cyberthreats evolving...
AI Tools for Research Paper Writing: Learn What They Can Do
Whether it’s the healthcare industry or the automobile sector, artificial intelligence has left its impact everywhere. People have started to...
The Startup Guide to Acquiring Exceptional Developers
In the fiercely competitive world of Hire Developers for Startup, success hinges not just on your product or service, but...
The Transformative Impact of Node.js on Web Development
As web development becomes more complex, Node.js has emerged as a versatile solution for building scalable and efficient web applications....
Average Rating