Visualize IoT-scale time-series data using Azure Time Series Insights
The Internet of Things (IoT) has opened up a new, virtually inexhaustible source of technical innovations, which are equally valuable for a broad variety of industries. Applying smart connected devices, sensors, and gateways to control each part of the production process, manufacturing, and infrastructure companies are dramatically increasing their operational efficiency. At the same time, the consumer tech market has exploded with an abundance of smart products and spin-off cloud services that they brought to life.
With this context, let us check one of the IoT use cases on how to visualize Device Data using Azure Time Series Insights.

Azure Time Series Insights is a fully managed analytics, storage, and visualization service for managing IoT-scale time-series data in the cloud. It provides massively scalable time-series data storage and enables to explore and analyze billions of events streaming in from all over the world in seconds. Using Time Series Insights we can store and manage terabytes of time-series data, explore and visualize billions of events simultaneously, conduct root-cause analysis, and compare multiple sites and assets.
Quick Snapshot
Why should I use Azure Time Series Insights ?
In this section, we look at some of the key features that Azure Time Series Insights offers :
- Fully integrated with cloud gateways like Azure IoT Hub and Azure Event Hubs.
- Warm and cold data analytics – Time Series Insights manages the storage of your data. You can interactively query billions of events in seconds on demand.
- Powerful visualization – Time Series Insights provides out-of-the-box visualization via the TSI explorer.
- Easy integration – Provides a query service, both in the TSI explorer and by using APIs that are easy to integrate for embedding your time series data into custom applications.
In the next section, we are going to look at how to
- Create a device
- Connecting the Pi Simulator to IoT Hub
- Send telemetry data to Azure
- Set up a Time Series Insights environment
- Analyze time series data from your IoT solutions or connected things
#1.Create a device
We will be using Azure IoT Hub service to connect the device simulator and start sending data. Azure IoT Hub is a fully managed service that enables reliable and secure bidirectional communications between millions of IoT devices and a solution back end.
With IoT Hub you can:
- Establish bi-directional communication with billions of IoT devices
- Authenticate per device for security-enhanced IoT solutions
- Register devices at scale with IoT Hub Device Provisioning Service
- Manage your IoT devices at scale with device management
- Extend the power of the cloud to your edge device
To start, click on Create a resource and click on the Internet of Things.

Create an IoT Hub to connect your real device or simulator.

Use an existing resource group or create a new one. In the Name field, enter a unique name for your IoT hub. The name of your IoT Hub must be unique across all IoT hubs.

In the Tier filed, select S1 tier. You can choose from several tiers depending on how many features you want and how many messages you send through your solution per day.
For details about the tier options, check out Choosing the right IoT Hub tier.

Now that IoT Hub is created, we would be connecting Devices in the next steps.
#2.Connect the simulator to IoT Hub
Go To your IoT Hub in the portal and click on IoT Devices, Click on+ Add and enter a Device and click Save.

Once the device is created, click on the device and copy the Primary Connection String.

Go to PI Simulator and replace the connection string with the Primary Connection String copied in the previous step.

Click Run and start sending messages. LED will start blinking, Messages will start flowing into IoT Hub that we created in the previous step.
#3.Set up a Time Series Insights environment
Click on Create a Resource and click on the Internet of Things.

Select the resource group or create a new one and click Create button.

Create Event Source to connect to IoTHub. Please make sure to use a unique Consumer Group.

Go To Time Series Insights, Click on Go To Environment which will take you to Time Series Insights Explorer.

Split By Device ID. You will see data flowing from two device simulator)
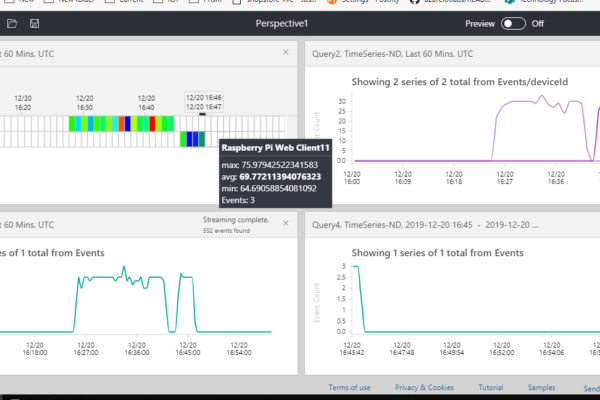
Create a perspective and Click + to add a new query with different parameters/charts.

Here is a sample of Perspective with 4 different charts.

Congrats! In this article, we have learned how to visualize Device Data using Azure Time Series Insights.
Like this post? Don’t forget to share it!
Additional Resources :
- 12 Open Source IoT Platforms that you should know
- Build real-time Twitter dashboard using Azure LogicApps + Power BI
- Serverless tutorial – On HTTP trigger store data in Azure Cosmos DB
- Running Kubernetes on Microsoft Azure
Summary
Article Name
Visualize IoT-scale time-series data using Azure Time Series Insights
Description
Learn how to visualize Device Data using Azure Time Series Insights.
Author
Karthik
Publisher Name
Upnxtblog
Publisher Logo


More Stories
The Power Of Contextualized Data: A Guide To Getting The Information You Need
In today's digital age, the amount or volume of data generated is enormous. While this data provides valuable insights, it...
IoT-Powered Decentralized Exchanges: The Future of Digital Asset Trading
The world of digital asset trading is rapidly evolving, and decentralized exchanges (DEXs) are becoming more popular as a way...
Unlocking the Potential of IoT Through Blockchain Technology
IoT refers to a network of physical objects or devices that are connected to the internet and can communicate with...
Hot Path Analytics with CosmosDB and Azure Functions
The Internet of Things (IoT) has opened up a new, virtually inexhaustible source of technical innovations, which are equally valuable...
How to build Digital Twin using Eclipse Ditto?
Digital Twins technology brings the exact replica in digital format of a process, a product, or a service. Basically, it...
The Perfect Pair: Digital Twins and Predictive Maintenance
Why Predictive Maintenance Now? Every business needs their essential equipment to operate at peak efficiency and utilization to realize their...
Average Rating